How to Check if Your PC Has a Bottleneck (5 Easy Methods)
Quick Answer+
Quick Answer: To check for a bottleneck, monitor CPU and GPU usage while gaming using MSI Afterburner or Task Manager. If CPU is at 90-100% while GPU is below 80%, you have a CPU bottleneck. If GPU is at 95-100% while CPU is below 70%, you have a GPU bottleneck (usually ideal). For instant results, use our Bottleneck Calculator to analyze your specific CPU and GPU combination.
Your new graphics card isn’t delivering the FPS you expected. Or your games stutter during action scenes despite having decent hardware. Or you’re planning a new build and want to ensure your components are balanced.
Whatever brought you here, checking for bottlenecks is essential for understanding and optimizing PC gaming performance. The good news: it’s straightforward once you know what to look for.
This guide walks you through five different methods to identify bottlenecks, from quick free tools to comprehensive benchmarking. By the end, you’ll know exactly whether your CPU, GPU, or something else is limiting your gaming performance.
What You’re Looking For
Before diving into methods, let’s clarify what constitutes a bottleneck:
Signs of a CPU Bottleneck
- CPU usage at 90-100% (or individual cores maxed)
- GPU usage below 80-85%
- Lowering graphics settings doesn’t improve FPS
- Raising resolution doesn’t significantly reduce FPS
- Stuttering during CPU-heavy moments (explosions, crowds, loading new areas)
Signs of a GPU Bottleneck (Usually Ideal)
- GPU usage at 95-100%
- CPU usage below 70-80%
- Lowering graphics settings significantly increases FPS
- Raising resolution proportionally reduces FPS
- Consistent frame times without stuttering
Quick Reference Chart
| CPU Usage | GPU Usage | Diagnosis |
|---|---|---|
| 90-100% | 50-80% | ❌ CPU Bottleneck |
| 70-85% | 70-85% | ✅ Balanced System |
| 40-70% | 95-100% | ✅ GPU Bottleneck (Ideal) |
| Low | Low | ⚠️ Frame cap, thermal issue, or other problem |
Now let’s explore five methods to check your system, starting with the quickest option.
Method 1: Use a Bottleneck Calculator (Fastest)
The quickest way to check for bottlenecks—especially before buying components—is using a bottleneck calculator. These tools compare your CPU and GPU performance tiers to estimate bottleneck percentage at different resolutions.
How to Use Our Bottleneck Calculator
Step 1: Navigate to our Bottleneck Calculator
Step 2: Select your CPU from the dropdown (or search by name)
Step 3: Select your GPU from the dropdown
Step 4: Choose your target resolution (1080p, 1440p, or 4K)
Step 5: Click “Calculate” to see your bottleneck analysis
The calculator shows:
- Estimated bottleneck percentage
- Which component is limiting (CPU or GPU)
- How the bottleneck changes at different resolutions
- Upgrade recommendations if needed
Interpreting Calculator Results
| Bottleneck % | Status | Meaning |
|---|---|---|
| 0-5% | ✅ Excellent | Nearly perfect balance |
| 5-10% | ✅ Good | Acceptable, minor limitation |
| 10-15% | ⚠️ Moderate | Noticeable but workable |
| 15-25% | ⚠️ Significant | Consider addressing |
| 25%+ | ❌ Severe | Upgrade recommended |
Calculator Limitations
Bottleneck calculators provide estimates based on typical gaming scenarios. Actual bottlenecks vary by:
- Specific games (some are CPU-heavy, others GPU-heavy)
- Graphics settings chosen
- RAM speed and capacity
- Background processes
- Thermal conditions
Use calculators for quick assessments and component planning. For definitive answers about your current system, use the monitoring methods below.
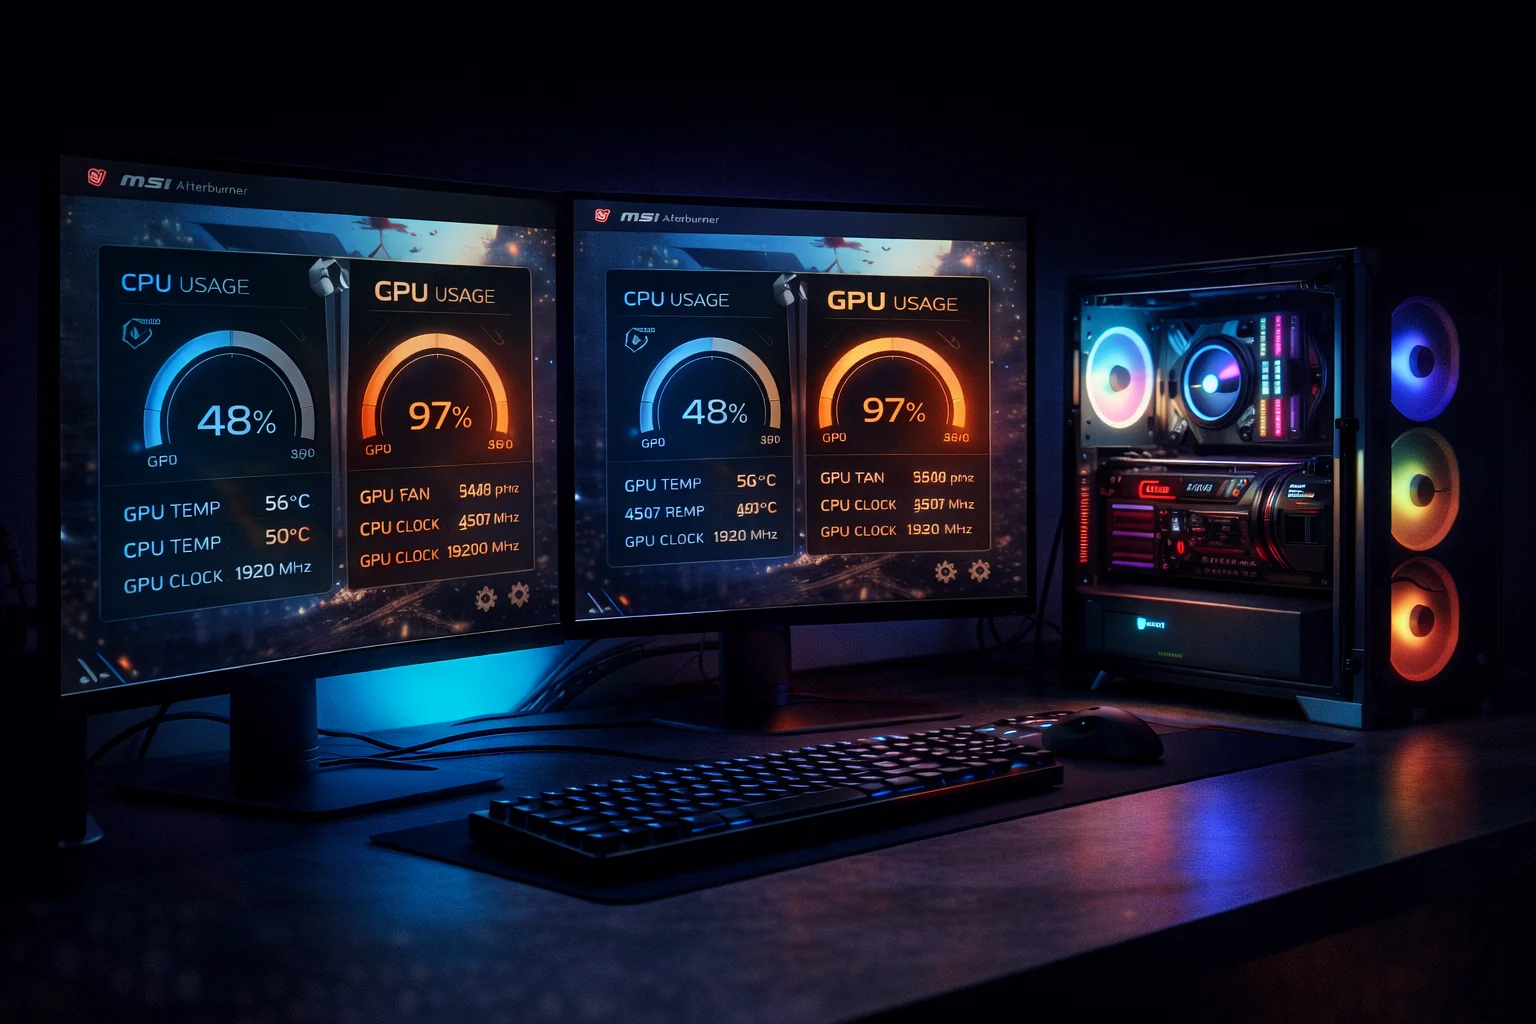
Method 2: Monitor with MSI Afterburner (Most Accurate)
MSI Afterburner with RivaTuner Statistics Server (RTSS) is the gold standard for real-time performance monitoring. It displays CPU, GPU, and other metrics as an overlay while gaming—completely free.
Setup Instructions
Step 1: Download and Install
- Download MSI Afterburner from guru3d.com or MSI’s website
- During installation, ensure “RivaTuner Statistics Server” is checked
- Complete installation and restart if prompted
Step 2: Configure Monitoring Settings
- Open MSI Afterburner
- Click the Settings (gear) icon
- Go to the “Monitoring” tab
- Enable these metrics by checking “Show in On-Screen Display”:
| Metric | Why It Matters |
|---|---|
| GPU Usage | Shows if GPU is fully utilized |
| GPU Temperature | Identifies thermal throttling |
| CPU Usage | Shows overall CPU load |
| CPU Usage per Core | Identifies single-thread bottlenecks |
| CPU Temperature | Identifies thermal throttling |
| Framerate | Your actual FPS |
| Frametime | Frame consistency (lower = smoother) |
| RAM Usage | Identifies memory limitations |
Step 3: Configure On-Screen Display
- Go to the “On-Screen Display” tab
- Set a hotkey to toggle the OSD (e.g., F12)
- In RTSS (running in system tray), set “Show On-Screen Display” to ON
Step 4: Monitor While Gaming
- Launch your game
- The overlay should appear automatically
- Play for at least 10-15 minutes, including demanding scenes
- Note CPU and GPU usage patterns
Reading the Results
Watch for these patterns during gameplay:
CPU Bottleneck Pattern:
- One or more CPU cores consistently at 95-100%
- GPU usage fluctuating between 50-85%
- FPS drops when CPU spikes occur
GPU Bottleneck Pattern (Healthy):
- GPU consistently at 95-99%
- CPU cores below 80% individually
- Stable frame times
Balanced System Pattern:
- GPU at 90-99%
- CPU at 70-85% (no single core maxed)
- Consistent FPS with minimal drops
Important: Check Per-Core CPU Usage
Total CPU usage can be misleading. A 16-core CPU might show 50% total usage, but if cores 0-3 are at 100% while cores 4-15 are idle, you still have a CPU bottleneck. Always enable per-core monitoring.
Method 3: Use Task Manager (Quick & Simple)
Windows Task Manager provides basic monitoring without installing additional software. It’s less detailed than MSI Afterburner but works for quick checks.
How to Check Bottleneck with Task Manager
Step 1: Press Ctrl + Shift + Esc to open Task Manager
Step 2: Click “More details” if in compact view
Step 3: Go to the “Performance” tab
Step 4: Position Task Manager on a second monitor or use a phone to record it
Step 5: Launch your game and play
Step 6: Alt-Tab periodically to check CPU and GPU percentages
What to Look For
In Task Manager’s Performance tab:
- CPU section: Shows overall usage and per-core view (right-click graph → “Change graph to” → “Logical processors”)
- GPU section: Shows GPU usage, memory, and temperature
- Memory section: Shows RAM usage
Task Manager Limitations
- No in-game overlay—requires second monitor or alt-tabbing
- Lower update frequency than dedicated tools
- Can’t see frame times or detailed per-core breakdown
- Alt-tabbing may affect game performance
Task Manager works for initial checks, but MSI Afterburner provides much better data for serious troubleshooting.
Method 4: The Resolution Test
This simple test definitively identifies whether you’re CPU or GPU limited without any monitoring software.
How the Test Works
Resolution changes GPU workload dramatically while barely affecting CPU workload. By comparing FPS at different resolutions, you can identify your bottleneck.
Step-by-Step Resolution Test
Step 1: Choose a consistent test scenario in your game (a benchmark run, specific location, or repeatable gameplay section)
Step 2: Set graphics to a fixed preset (e.g., High) and keep it constant throughout testing
Step 3: Run the test at 1080p and record average FPS
Step 4: Change only resolution to 1440p, run the same test, record FPS
Step 5: Change only resolution to 4K (or 720p if you started at 1080p), run test, record FPS
Interpreting Results
Example A – GPU Bottleneck (Healthy):
- 1080p: 140 FPS
- 1440p: 95 FPS
- 4K: 50 FPS
FPS drops proportionally with resolution increase. The GPU is doing more work at higher resolutions. This is a healthy GPU bottleneck.
Example B – CPU Bottleneck:
- 1080p: 95 FPS
- 1440p: 92 FPS
- 4K: 88 FPS
FPS barely changes despite massive resolution increases. The GPU isn’t the limiting factor—the CPU is capping performance regardless of GPU workload.
Example C – Mixed/Balanced:
- 1080p: 120 FPS
- 1440p: 100 FPS
- 4K: 60 FPS
Some scaling but not proportional—slight CPU limit at 1080p transitioning to GPU limit at 4K. This is common and generally acceptable.
Method 5: The Graphics Settings Test
Similar to the resolution test, changing graphics quality reveals whether GPU or CPU is limiting performance.
How to Perform the Test
Step 1: Choose a consistent test scenario
Step 2: Keep resolution constant (e.g., 1080p)
Step 3: Run at Ultra settings, record FPS
Step 4: Run at Medium settings, record FPS
Step 5: Run at Low settings, record FPS
Interpreting Results
Example A – GPU Bottleneck:
- Ultra: 55 FPS
- Medium: 95 FPS
- Low: 150 FPS
Huge FPS gains from lowering settings confirm GPU limitation. You can trade quality for performance.
Example B – CPU Bottleneck:
- Ultra: 80 FPS
- Medium: 85 FPS
- Low: 88 FPS
Minimal gains despite dramatically reducing GPU workload. CPU is the bottleneck.
Other Potential Bottlenecks to Check
CPU and GPU aren’t the only possible bottlenecks. If your testing shows neither component maxed out, check these:
RAM Bottleneck
Symptoms:
- RAM usage consistently above 90%
- Stuttering when loading new areas
- Long loading times
- High disk usage during gameplay
Solution: Upgrade to 16GB minimum for modern gaming, 32GB for heavy multitasking.
RAM Speed Bottleneck
Symptoms:
- Lower FPS than expected despite adequate CPU/GPU
- Particularly noticeable on AMD Ryzen systems
- XMP/EXPO not enabled in BIOS
Solution: Enable XMP/EXPO profile in BIOS. Consider upgrading from DDR4-2400 to DDR4-3600 or faster.
VRAM Bottleneck
Symptoms:
- Stuttering at high texture settings
- GPU VRAM usage at 95-100%
- Textures pop-in or appear low quality momentarily
- Worse performance at 4K despite adequate GPU power
Solution: Lower texture quality setting, reduce resolution, or upgrade to a GPU with more VRAM.
Thermal Throttling
Symptoms:
- Performance degrades over time during gaming sessions
- CPU temperatures above 90°C or GPU above 85°C
- Clock speeds dropping during sustained load
Solution: Improve cooling (add fans, replace thermal paste, improve airflow), or reduce room temperature.
Storage Bottleneck
Symptoms:
- Long loading times
- Texture pop-in during gameplay
- Stuttering when entering new areas
- 100% disk usage during gaming
Solution: Move games to an SSD. For more information, see our Best SSD for Gaming guide.
What to Do After Finding a Bottleneck
Once you’ve identified your bottleneck, here are your options:
If You Have a CPU Bottleneck
| Option | Cost | Effectiveness |
|---|---|---|
| Increase resolution | Free | High (shifts load to GPU) |
| Close background apps | Free | Low-Medium |
| Overclock CPU | Free | Medium (5-15% gain) |
| Upgrade RAM speed | $60-120 | Medium (5-15% gain) |
| Upgrade CPU | $200-500+ | High (definitive fix) |
For detailed solutions, see our CPU Bottleneck Fix Guide.
If You Have a GPU Bottleneck
| Option | Cost | Effectiveness |
|---|---|---|
| Enable DLSS/FSR | Free | Very High (30-70% gain) |
| Lower graphics settings | Free | High |
| Lower resolution | Free | Very High |
| Overclock GPU | Free | Medium (5-15% gain) |
| Upgrade GPU | $200-2000+ | High (definitive fix) |
For detailed solutions, see our GPU Bottleneck Guide.
Frequently Asked Questions
Monitor both components while gaming using MSI Afterburner. If your CPU (or individual CPU cores) are at 90-100% while your GPU stays below 80-85%, your CPU is bottlenecking. Another test: if lowering graphics settings doesn’t improve FPS, it’s a CPU bottleneck.
Yes, several free options exist. Our Bottleneck Calculator provides instant estimates. For real-time testing, MSI Afterburner (free) shows CPU/GPU usage while gaming. Windows Task Manager also works for basic checks. The resolution and settings tests require no software at all.
GPU usage below 80-85% during demanding games suggests a CPU bottleneck (GPU should be higher). Usage of 95-100% indicates healthy GPU utilization—this is the ideal scenario where your graphics card is fully utilized. Usage below 60% definitely indicates a CPU bottleneck or other issue.
Not simultaneously—one component is always the primary limiter. However, different games and scenarios can shift the bottleneck. You might be CPU-limited in Counter-Strike 2 but GPU-limited in Cyberpunk 2077. A well-balanced system has both components working hard (80-95% usage).
Bottleneck calculators provide useful estimates for comparing components and planning builds. They’re based on benchmark data and typical gaming scenarios. However, real-world bottlenecks vary by game, settings, and resolution. Use calculators for guidance, then verify with actual monitoring if you experience issues.
Several possibilities: CPU bottleneck (most common), frame rate cap enabled (V-Sync, in-game limiter), thermal throttling, driver issues, or the game simply isn’t demanding enough. Check for frame rate caps first, then monitor CPU usage to identify CPU bottleneck.
Check when you upgrade components, install new demanding games, or notice unexpected performance issues. There’s no need for regular checking if your system runs well. After any hardware change, a quick bottleneck check confirms your components are balanced.
Bottom Line
Checking for bottlenecks is straightforward once you know what to look for. The key metrics are CPU and GPU usage—when one component is maxed while the other has headroom, you’ve found your bottleneck.
Fastest method: Use our Bottleneck Calculator for instant estimates based on your components.
Most accurate method: Monitor with MSI Afterburner while gaming. Watch for CPU cores at 100% with GPU below 85% (CPU bottleneck) or GPU at 99% with CPU below 70% (GPU bottleneck—usually ideal).
No-software method: Compare FPS at different resolutions. If FPS barely changes when you increase resolution, you have a CPU bottleneck. If FPS drops proportionally, you have a GPU bottleneck.
Remember: a GPU bottleneck is usually desirable. It means you’re fully utilizing your graphics card and can adjust settings to trade quality for FPS. CPU bottlenecks are more problematic because settings changes don’t help much.
Related Guides
- Bottleneck Calculator – Check Your CPU & GPU Pairing
- FPS Calculator – Estimate Gaming Frame Rates
- What Is a CPU Bottleneck? How to Identify & Fix It
- What Is a GPU Bottleneck? Signs & Solutions
- Best SSD for Gaming 2026
- Best NVMe SSD 2026
Last Updated: February 2026