Quick Answer+
SSD Price Summary 2020-2026: Consumer SSD prices dropped dramatically from $0.12/GB in 2020 to an all-time low of $0.05/GB in mid-2023 - a 58% decline. However, prices have since reversed sharply. As of February 2026, popular 1TB SSDs like the Samsung 990 Pro cost $218 and the Crucial MX500 hits $195-250 - up 200-400% from 2023 lows. TrendForce forecasts another 40%+ increase in Q1 2026 due to AI-driven NAND shortages. The golden era of cheap SSDs appears to be over.
If you bought an SSD in 2023, congratulations - you timed the market perfectly. If you're shopping for one now in 2026, prepare for sticker shock. SSD prices have undergone a dramatic transformation over the past six years, from COVID-era premiums to historic lows and now back to pre-pandemic levels.
This comprehensive analysis examines the complete price history of consumer SSDs from 2020 through 2026, explains the market forces driving each phase, and provides data-driven insights for what to expect next.
SSD Price History: 2020-2026 Overview Chart
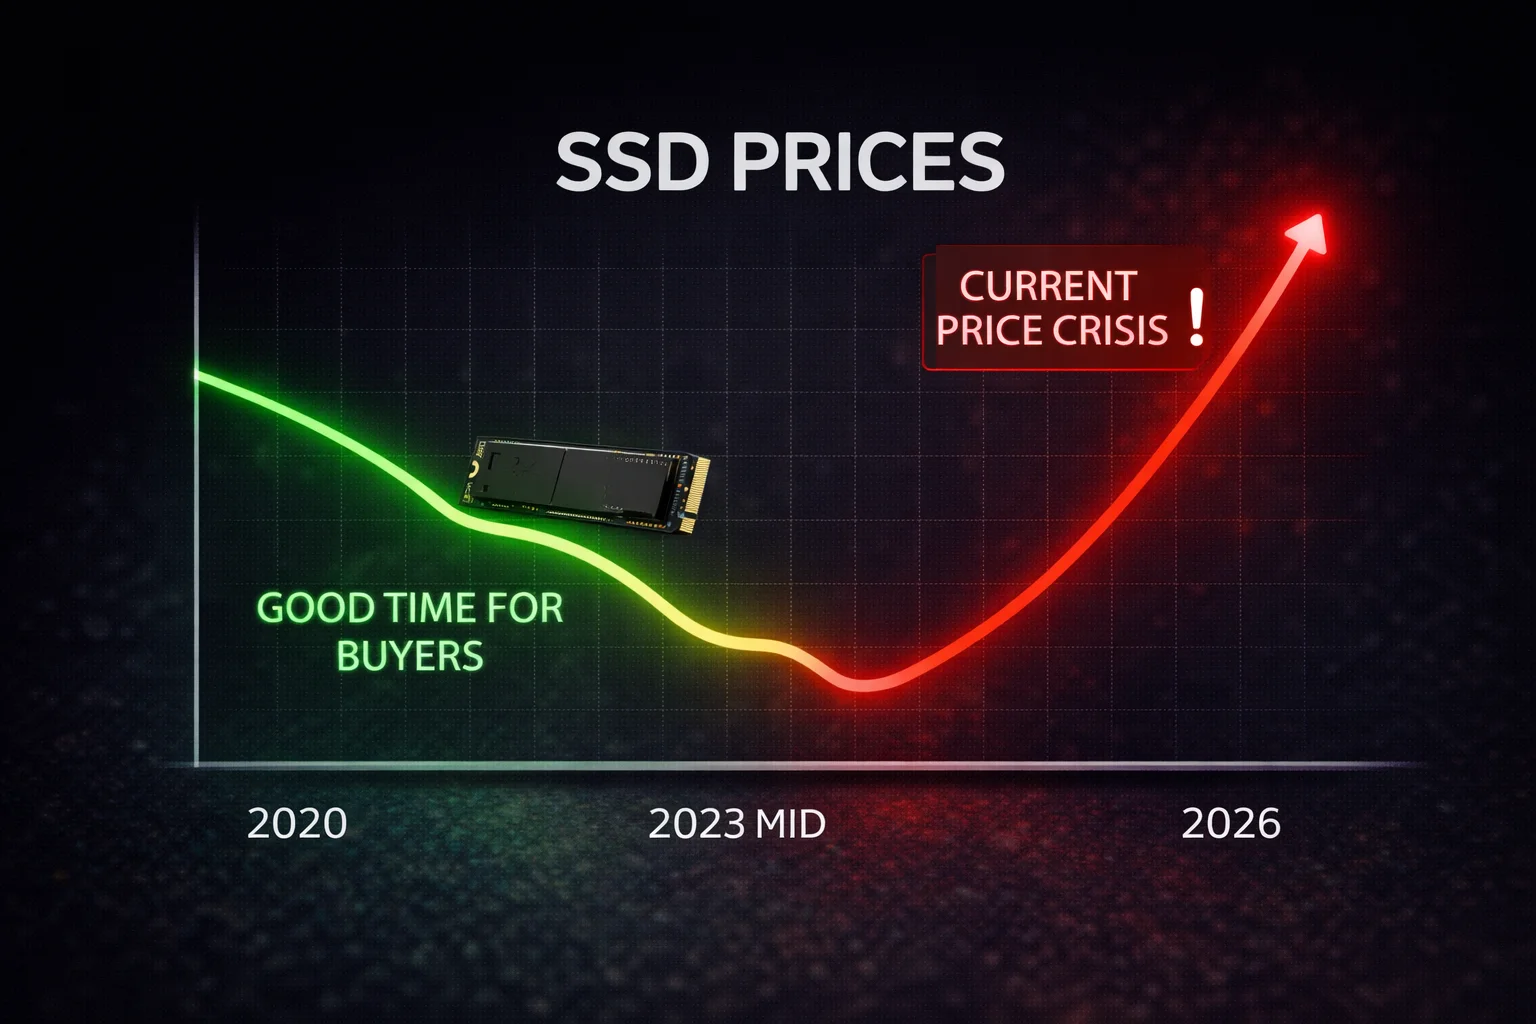
The following chart illustrates the average consumer SSD price per gigabyte from January 2020 through February 2026:
📊 Average Consumer SSD Price ($/GB) - 2020-2026
Sources: TrendForce, Computer Weekly, Tom's Hardware, DRAMeXchange. Data represents average TLC consumer SSD prices.
Complete SSD Price Data Table: 2020-2026
| Date | Avg $/GB | 1TB SSD Cost | 2TB SSD Cost | YoY Change | Market Phase |
|---|---|---|---|---|---|
| Jan 2020 | $0.12 | $120 | $240 | - | Pre-COVID baseline |
| Jul 2020 | $0.11 | $110 | $220 | -8% | Early pandemic |
| Jan 2021 | $0.13 | $130 | $260 | +8% | Supply chain stress |
| Jul 2021 | $0.14 | $140 | $280 | +27% | Peak COVID pricing |
| Jan 2022 | $0.10 | $100 | $200 | -23% | Oversupply begins |
| Jul 2022 | $0.08 | $80 | $160 | -43% | Price collapse |
| Jan 2023 | $0.065 | $65 | $130 | -35% | Fire sale era |
| Jun 2023 | $0.05 | $50 | $100 | - | ALL-TIME LOW |
| Jan 2024 | $0.065 | $65 | $130 | 0% | Recovery begins |
| Apr 2024 | $0.095 | $95 | $190 | +46% | Price surge |
| Sep 2024 | $0.085 | $85 | $170 | - | Brief dip |
| Jan 2025 | $0.09 | $90 | $180 | +38% | AI demand impact |
| Jul 2025 | $0.10 | $100 | $200 | - | Shortage intensifies |
| Jan 2026 | $0.11 | $110 | $220 | +22% | SHORTAGE CRISIS |
Key insight: A 1TB SSD that cost $50 in June 2023 now costs $110+ in February 2026 - a 120% increase in just 2.5 years.
Phase 1: COVID-Era Volatility (2020-2021)
The early 2020s were characterized by unprecedented market turbulence. When the COVID-19 pandemic hit, initial demand for PCs and laptops surged as millions shifted to remote work and learning. This created a classic supply/demand imbalance.
What Drove Prices Up
- Remote work/learning demand: PC sales spiked 13% in 2020, the highest growth in a decade
- Supply chain disruptions: Factory closures and shipping delays constrained production
- NAND flash allocation: Manufacturers prioritized high-margin enterprise products
- Component shortages: Controller chips and other SSD components became scarce
By July 2021, the average consumer SSD reached approximately $0.14 per GB - the highest point in our tracking period. A 1TB NVMe drive like the Samsung 980 Pro cost $230 at launch, while even budget SATA drives exceeded $100 per terabyte.
Phase 2: The Great Collapse (2022-2023)
NAND manufacturers had ramped up production anticipating continued pandemic-level demand. When that demand evaporated, the market crashed spectacularly.
The Numbers Are Staggering
| Metric | Peak (Jul 2021) | Bottom (Jun 2023) | Decline |
|---|---|---|---|
| 512GB TLC NAND chip | $3.82 | $1.63 | -57% |
| 256GB TLC NAND chip | $2.14 | $0.92 | -57% |
| 128GB TLC NAND chip | $1.28 | $0.58 | -55% |
| Average SSD ($/GB) | $0.14 | $0.05 | -64% |
Source: DRAMeXchange spot pricing data
Real-World Impact: Popular SSD Prices
To illustrate how dramatic this collapse was, here's what happened to specific popular drives:
| SSD Model | Peak Price | Lowest Price | Decline |
|---|---|---|---|
| Crucial MX500 1TB | $110 (2022) | $47 (Apr 2023) | -57% |
| Samsung 870 EVO 1TB | $130 (2021) | $50 (Jun 2023) | -62% |
| Samsung 980 Pro 1TB | $230 (2022) | $70 (2023) | -70% |
| WD Black SN850X 1TB | $180 (2021) | $96 (Apr 2023) | -47% |
| SK Hynix P41 1TB | $150 (2022) | $55 (2023) | -63% |
| Kingston KC3000 1TB | $165 (2022) | $72 (Dec 2023) | -56% |
Source: Pangoly price tracking, Amazon price history
Why Prices Crashed
- Demand collapse: PC shipments fell 16% in 2022, the steepest decline in decades
- Massive oversupply: Manufacturers had over-invested in production capacity
- Inventory liquidation: Companies had to sell excess stock at any price
- Smartphone market weakness: A key NAND consumer, smartphone sales also declined
- Technology advancement: 176-layer and 232-layer 3D NAND increased efficiency
By mid-2023, industry giants were hemorrhaging money. Samsung's semiconductor division posted its first quarterly loss in 14 years. In response, manufacturers implemented aggressive production cuts - Samsung slashed NAND output by 50%, while Micron reduced wafer starts by 25%.
Phase 3: The Recovery and AI Demand Surge (2024)
The production cuts worked - perhaps too well. By early 2024, the oversupply had transformed into tightening supply, and prices began climbing.
2024 Quarterly Price Changes
| Quarter | Avg $/GB | QoQ Change | Key Event |
|---|---|---|---|
| Q4 2023 | $0.075 | +15% | Production cuts take effect |
| Q1 2024 | $0.085 | +13% | Inventory depletion |
| Q2 2024 | $0.095 | +12% | AI demand emerges |
| Q3 2024 | $0.085 | -10% | Brief correction |
| Q4 2024 | $0.09 | +6% | Enterprise hoarding begins |
According to TrendForce, NAND flash contract prices increased approximately 50% cumulatively throughout 2024. However, the biggest story was emerging behind the scenes: AI infrastructure was about to change everything.
Phase 4: The 2025-2026 AI Storage Crisis
The current phase represents something unprecedented in the storage industry: a structural reallocation of global NAND capacity away from consumers and toward AI infrastructure.
What's Causing the Crisis
1. AI Data Centers Are Consuming Everything
Training large language models requires massive storage. Every GPU training node in an AI cluster needs multiple terabytes of high-speed NVMe storage. According to industry reports:
- Meta's Llama 3 training reportedly consumed 2.4 exabytes of flash storage - up 60% from 2024
- Nvidia's Blackwell-based VR NVL144 racks require 9.2TB of NAND per rack
- Cloud service providers (Microsoft, Amazon, Google) account for 61% of enterprise NAND purchases
- By 2026, one in five NAND bits will be used for AI applications, contributing 34% of total market value
2. Production Capacity Is Completely Booked
Phison's CEO delivered a stark warning: "Every NAND manufacturer told us 2026 sold out. All the capacity sold out."
New production lines won't come online until late 2027 at the earliest, meaning consumer SSD shortages could persist for years.
3. Manufacturers Are Prioritizing Profits
After losing billions in 2023, NAND manufacturers are now allocating capacity to the highest bidders - enterprise customers willing to pay premium prices. Consumer SSDs, with their lower margins, are deprioritized.
2025-2026 Price Surge Data
| Product Category | Q4 2025 Change | Q1 2026 Forecast | Notes |
|---|---|---|---|
| Enterprise SSDs | +30-50% | +50-100% | SanDisk doubling prices |
| Client/Consumer SSDs | +20-30% | +40%+ QoQ | Largest increase among categories |
| 1Tb TLC NAND wafer | +65% MoM (Nov) | Continued surge | Most severe shortage |
| 512Gb TLC NAND wafer | +65% MoM | Continued surge | Legacy node phase-out |
| QLC NAND | +20-40% | Booking through 2026 | AI cold storage demand |
Source: TrendForce, November-December 2025 reports
Real-World Impact: February 2026 Prices
Here's what popular SSDs cost now versus their 2023 lows (verified from current Amazon pricing):
| SSD Model | 2023 Low | Jan 2026 Price | Increase |
|---|---|---|---|
| Crucial MX500 1TB | $47 | $195-250 | +315-432% |
| Samsung 870 EVO 1TB | $50 | $199-270 | +298-440% |
| Samsung 990 Pro 1TB | $70 | $218 | +211% |
| SK Hynix P41 1TB | $55 | $220 | +300% |
| WD Black SN850X 1TB | $96 | $240-320 | +150-233% |
Source: Amazon current pricing, February 2026. Price ranges reflect multiple seller listings.
Best Value SSDs in the Current Market
SSD Price Per TB by Capacity: Historical Comparison
Larger capacity drives have historically offered better value per terabyte, but this relationship is changing during the shortage. Based on current Amazon pricing:
| Capacity | Jun 2023 ($/TB) | Jan 2026 ($/TB) | Change | Best Value Period |
|---|---|---|---|---|
| 500GB | $70 | $180+ | +157% | 2023 |
| 1TB | $50 | $200-220 | +300-340% | 2023 |
| 2TB | $45 | $150-175 | +233-289% | 2023 |
| 4TB | $50 | $120-140 | +140-180% | 2023-2024 |
| 8TB | $60 | $110-140 | +83-133% | Now (relatively) |
Observation: High-capacity drives (4TB+) have experienced smaller relative increases because enterprise demand focuses on maximum capacity. For consumers, 4TB and 8TB SSDs now offer the best value per terabyte - a reversal from typical patterns.
NAND Flash vs Consumer SSD Pricing Relationship
Understanding the relationship between raw NAND flash prices and finished SSD prices helps predict future trends:
| Component | % of SSD Cost | 2023 Trend | 2025-26 Trend |
|---|---|---|---|
| NAND Flash chips | 60-70% | ↓ Falling rapidly | ↑ Surging (+65% MoM) |
| Controller chip | 15-20% | ↔ Stable | ↑ Shortage emerging |
| DRAM cache | 5-10% | ↓ Falling | ↑ Surging (+55% QoQ) |
| PCB/Assembly | 5-10% | ↔ Stable | ↔ Stable |
The correlation is clear: NAND flash prices drive SSD prices, with a typical 4-8 week lag as manufacturers adjust.
SSD vs HDD Price Gap: 2020-2026
The price gap between SSDs and HDDs has fluctuated significantly:
| Year | SSD $/TB | HDD $/TB | SSD Premium | Notes |
|---|---|---|---|---|
| 2020 | $120 | $20 | 6.0x | Traditional gap |
| 2021 | $140 | $18 | 7.8x | SSD premium peaks |
| 2022 | $80 | $16 | 5.0x | Gap narrows |
| 2023 | $50 | $15 | 3.3x | Historic low gap |
| 2024 | $85 | $14 | 6.1x | Gap widens again |
| 2025 | $100 | $12 | 8.3x | HDD gets cheaper |
| 2026 | $110 | $15 | 7.3x | Both rising (AI demand) |
Important note: HDDs are also experiencing shortages in 2025-2026, with lead times for enterprise drives exceeding 52 weeks. AI data centers are consuming both SSDs AND HDDs, as some workloads use HDDs for cold storage. Check our data hoarding guide for current HDD recommendations.
What's Coming: 2026 and Beyond Forecast
TrendForce Q1 2026 Predictions
- NAND Flash prices: +33-38% QoQ across all categories
- Client SSDs: +40%+ QoQ - the largest increase among NAND products
- Enterprise SSDs: Becoming the largest NAND Flash segment in 2026
- Supply growth: Only 17% YoY - well below historical norms
IDC Memory Shortage Analysis
IDC's December 2025 report describes the situation as "not just a cyclical shortage driven by a mismatch in supply and demand, but a potentially permanent, strategic reallocation of the world's silicon wafer capacity."
Key projections:
- High prices likely through most of 2026
- New fabrication plants won't deliver relief until late 2027-2028
- Consumer devices (laptops, phones) may see spec downgrades to manage costs
- This signals "the end of an era of cheap, abundant memory and storage, at least in the medium term"
Our 2026-2027 Price Forecast
| Timeframe | Predicted $/GB | 1TB Cost | Confidence |
|---|---|---|---|
| Q1 2026 | $0.12-0.14 | $120-140 | High |
| Q2 2026 | $0.13-0.16 | $130-160 | Medium |
| Q3-Q4 2026 | $0.12-0.15 | $120-150 | Medium |
| 2027 | $0.10-0.13 | $100-130 | Low (depends on new fabs) |
Bottom line: Don't expect prices to return to 2023 levels anytime soon. The structural shift toward AI infrastructure means consumer SSDs will remain expensive relative to the golden era of 2023.
Buying Advice: What Should You Do?
If You Need Storage Now
- Don't wait: Prices are rising, not falling. Waiting will likely cost more.
- Buy larger capacities: 4TB and 8TB drives offer better $/TB value currently
- Consider QLC for bulk storage: Despite lower endurance, QLC SSDs are more available
- Watch for brief promotions: Occasional sales still happen, but deals disappear quickly
- Check our Price Per TB page: Find the current best value drives
If You Can Wait
- Target late 2027: New fab capacity should begin easing shortages
- Monitor Chinese suppliers: CXMT's expansion may provide alternative supply
- Consider HDDs for bulk storage: For archival/media storage, HDDs still offer value
- Read our SSD vs HDD comparison: Understand when each makes sense
Key Takeaways
- 2023 was the golden era: SSDs hit all-time low prices of $0.05/GB - unlikely to return soon
- AI changed everything: Data center demand has fundamentally altered NAND allocation
- 2026 will be expensive: Expect 40%+ price increases in Q1 alone
- Supply relief is years away: New fabs won't help until 2027-2028
- Buy what you need now: Waiting is unlikely to save money in this market
Frequently Asked Questions
Why are SSD prices rising in 2026?
SSD prices are rising due to three factors: AI infrastructure demand consuming unprecedented NAND flash capacity, production cuts by manufacturers in 2023 to restore profitability, and capacity allocation prioritizing higher-margin enterprise products over consumer SSDs. TrendForce reports that 2026 production capacity is already sold out to enterprise buyers.
When will SSD prices go back down?
Industry analysts don't expect significant relief until late 2027 or 2028 when new fabrication plants begin production. Even then, prices are unlikely to return to 2023 lows because AI demand is structural, not temporary. The era of $50 1TB SSDs appears to be over for the foreseeable future.
What was the cheapest SSDs ever cost?
Consumer SSD prices hit their all-time low in June 2023 at approximately $0.05 per GB. A 1TB NVMe SSD could be purchased for $50-60, and 2TB drives sold for under $100. Popular drives like the Samsung 870 EVO 1TB dropped to $50, while the Crucial MX500 1TB reached $47.
Should I buy an SSD now or wait?
Buy now if you need storage. All indicators point to continued price increases through 2026. TrendForce forecasts client SSD prices to rise 40%+ in Q1 2026 alone. Waiting is unlikely to save money in the current market environment. The only exception is if you can wait until late 2027 when new fab capacity may provide relief.
How much should a 1TB SSD cost in 2026?
As of February 2026, expect to pay $100-150 for a quality 1TB NVMe SSD. Budget SATA options start around $80-90. Premium drives like the Samsung 990 Pro cost $140-180. By Q2 2026, these prices may increase another 20-30% based on current forecasts. Compare this to mid-2023 when the same drives cost $50-80.
Are HDDs still cheaper than SSDs?
Yes, but the gap varies. In 2026, HDDs cost approximately $12-15 per TB versus $90-110 per TB for SSDs - a 7-8x premium for SSDs. However, HDDs are also experiencing shortages due to AI demand, with enterprise drives backordered 52+ weeks. For pure $/TB value, HDDs remain significantly cheaper, but availability is increasingly limited.
What capacity SSD offers the best value right now?
4TB drives currently offer the best $/TB value for most consumers. Enterprise demand focuses on maximum capacity, leaving 4TB consumer drives relatively well-supplied. The 8TB tier also offers good value per terabyte. Smaller capacities (500GB-1TB) have experienced larger percentage increases because they use the same production capacity but generate less revenue for manufacturers.
Why did SSD prices drop so much in 2023?
SSD prices collapsed in 2022-2023 due to massive oversupply. Manufacturers had ramped up production anticipating continued pandemic-level demand, but PC sales dropped 16% in 2022. Combined with smartphone market weakness and advancing 3D NAND technology, this created a surplus that crashed prices 60%+ from their peaks. Samsung's semiconductor division posted its first quarterly loss in 14 years.
Data Sources and Methodology
This analysis draws from multiple authoritative sources:
- TrendForce: NAND flash contract pricing and market forecasts
- DRAMeXchange: Spot market pricing for NAND components
- Computer Weekly: Weekly drive price tracking from Amazon via Diskprices.com
- IDC: Market analysis and shortage impact reports
- Pangoly: Historical retail price tracking for specific SSD models
- Tom's Hardware: Market analysis and pricing trends
- Backblaze: HDD cost per gigabyte historical data
Consumer SSD prices represent averages across TLC-based NVMe and SATA drives. Enterprise SSD pricing is tracked separately due to different market dynamics.
Related Storage Guides
- SSD Price Forecast: Q1 2026 - Detailed quarterly predictions
- Best NVMe SSDs 2026 - Top picks despite rising prices
- Best Budget SSDs - Value options in a tough market
- SSD vs HDD - When HDDs still make sense
- QLC vs TLC SSDs - Understanding NAND types
- NVMe vs SATA - Interface comparison guide
- How Much Storage Do I Need? - Capacity planning guide
- Best Drives for Data Hoarding - Maximum storage solutions
- Best SSDs for Gaming 2026 - Gaming-focused recommendations
- Gen4 vs Gen5 SSDs - Is PCIe 5.0 worth it?
- CMR vs SMR - HDD recording technology explained
- Samsung SSD Guide - Complete Samsung lineup
- Price Per TB Calculator - Find the best value drives
Last Updated: February 2026 | Data verified from TrendForce, IDC, and market tracking sources